What is Ratio Analysis?
Ratio analysis is a quantitative method/tool to predict operational as-well-as financial efficiency of business through analysis & interpretation of financial data.
So analysis of financial statement is a process of selection, relation and evaluation. The first task of the financial analyst is to select the information relevant to the decision under consideration.
Table of Contents
- 1 What is Ratio Analysis?
- 2 Ratio Analysis Definition
- 3 Advantages of Ratio Analysis
- 3.1 Helpful in Analysis of Financial Statements
- 3.2 Simplification of Accounting Data
- 3.3 Helpful in Comparative Study
- 3.4 Helpful in Locating the Weak Spots of the Business
- 3.5 Helpful in Forecasting
- 3.6 Estimate About the Trend of the Business
- 3.7 Fixation of Ideal Standards
- 3.8 Effective Control
- 3.9 Study of Financial Soundness
- 4 Limitations of Ratio Analysis
- 4.1 False accounting Data Gives False Ratios
- 4.2 Less Effective Due to Price Level Changes
- 4.3 Misleading in the Absence of Absolute Data
- 4.4 Limited Use of a Single Ratio
- 4.5 Window-Dressing
- 4.6 Lack of Proper Standards
- 4.7 Ration alone are not adequate for proper conclusions
- 4.8 Effect of personal ability and bias of the Analyst
- 5 Classification of Ratios
- 6 Approaches for Interpretation Ratios
- 7 Classification of Ratio Analysis
The second step is to arrange the information in a way to highlight significant relationships. The final step is interpretation and drawing of inferences and conclusions.
The present chapter involves an in-depth analysis of financial statements and its use for decision making by various parties interested in them.
Ratio Analysis Definition
The term “Ratio” simply means one number expressed in terms of another. It describes in mathematical terms the quantitative relationship that exists between two numbers.
The term “Accounting Ratio” is used to describe significant relationship between figures shown on a Balance Sheet, in a Profit and Loss Account.
Ratio analysis refers to the analysis and interpretation of financial statements through ratios.
Ratios are customarily presented either in the form of a coefficient or a percentage or as a proportion. Absolute figures may be misleading unless compared, one with another. Ratios provide the means of showing the relationship that exists between figures.
However, the numerical relationships of the kind expressed by ratio analysis are not an end in themselves but are a means for understanding the financial position of a business.
Ratios, by themselves, are meaningless, simple ratios compiled from a single years’ financial statements of an enterprise may not serve the real purpose.
Advantages of Ratio Analysis
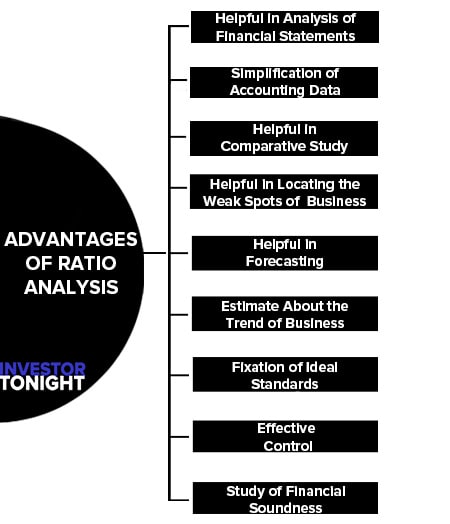
Advantages of ratio analysis are:
- Helpful in Analysis of Financial Statements
- Simplification of Accounting Data
- Helpful in Comparative Study
- Helpful in Locating the Weak Spots of the Business
- Helpful in Forecasting
- Estimate About the Trend of the Business
- Fixation of Ideal Standards
- Effective Control
- Study of Financial Soundness
Helpful in Analysis of Financial Statements
Ratio analysis is an extremely useful device for analyzing the financial statements. It helps the bankers, creditors, investors, shareholders etc. in acquiring enough knowledge about the profitability and financial health of the business.
Simplification of Accounting Data
Accounting ratio simplifies and summarizes a long array of accounting data and makes them understandable. It discloses the relationship between two such figures which have a cause and effect relationship with each other.
Helpful in Comparative Study
With the help of ratio analysis comparison of profitability and financial soundness can be made between one firm and another in the same industry. Similarly, comparison of current year figures can also be made with those previous years with the help of ratio analysis.
Helpful in Locating the Weak Spots of the Business
Current year’s ratios are compared with those of the previous years and if some weak spots are located, remedial measures are taken to correct them.
Helpful in Forecasting
Accounting ratios are very helpful in forecasting and preparing the plans for the future.
For example, if sales of a firm during this year are Rs. 10 Lakhs and the average amount of stock kept during the year was Rs. 2 Lakhs, i.e., 20% of sales and if the firm wishes to increase sales in next year to Rs.15 Lakhs, it must be ready to keep a stock of Rs.3, 00,000, i.e., 20% of 15 Lakhs.
Estimate About the Trend of the Business
If accounting ratios are prepared for a number of years, they will reveal the trend of costs, sales, profits and other important facts
Fixation of Ideal Standards
Ratios help us in establishing ideal standards of the different items of the business. By comparing the actual ratios calculated at the end of the year with the ideal ratios, the efficiency of the business can be easily measured.
Effective Control
Ratio analysis discloses the liquidity, solvency and profitability of the business enterprise. Such information enables management to assess the changes that have taken place over a period of time in the financial activities of the business.
It helps them in discharging their managerial functions, e.g., planning, organizing, directing, communicating and controlling more effectively.
Study of Financial Soundness
Ratio analysis discloses the position of business with different view’-points. It discloses the-position of business with the liquidity point of view, solvency point of view, profitability point of view etc.
With the help of such a study we can draw conclusions regarding the financial health of the business enterprise.
Limitations of Ratio Analysis
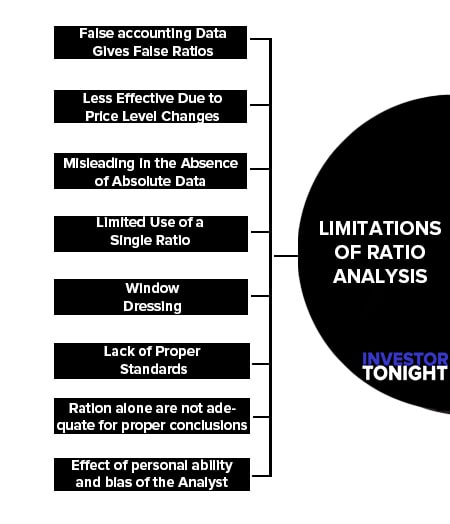
Following are the limitations of ratio analysis:
- False accounting Data Gives False Ratios
- Less Effective Due to Price Level Changes
- Misleading in the Absence of Absolute Data
- Limited Use of a Single Ratio
- Window-Dressing
- Lack of Proper Standards
- Ration alone are not adequate for proper conclusions
- Effect of personal ability and bias of the Analyst
False accounting Data Gives False Ratios
Accounting ratios are calculated on the basis of data given in profit and loss account and balance sheet. Therefore, they will be only as correct as the accounting data on which they are-based.
For example, if the -closing stock is overvalued, not only the profitability will be overstated but also the financial position will appear to be better.
Comparison not possible if the different Firms Adopt Different Accounting Policies: There may be different accounting policies adopted by different firms with regard to providing depreciation, creation of provision for doubtful debts, method of valuation of closing stock etc.
Less Effective Due to Price Level Changes
Price level over the years goes on changing; therefore, the ratios of various years cannot be compared.
For example, one firm sells 1,000 Machines for Rs. 10 Lakhs dunng2002, it again sells 1,500 Machines of the same type in 2003 but owing to rising prices the sale price was Rs. 15 Lakhs. On the basis of ratios it will be concluded that the sales have increased by 50%, whereas in actual,-sales have not increased at all.
Hence, the figures of the past years must be adjusted in the light of price level changes before the ratios for these years are compared. ‘
Misleading in the Absence of Absolute Data
For example, X company produces 10 lakh meters of cloth in 2002 and 15 Lakh meters in 2003, the progress is 50%. Y Company raises its production from 10 thousand meters in 2002 to 20 thousand meters in 2003, the progress is 100%.
Comparison of these two firms made on the basis of ratio will disclose that the second firm is more active than the first firm. Such conclusion is quite misleading because of the difference in the size of the two firms. It is, therefore, essential to study the ratios along with the absolute data on which they are based.
Limited Use of a Single Ratio
The analyst should not merely rely on a single ratio. He should study several connected ratio before reaching a conclusion.
For example, the Current Ratio of a firm may be quite satisfactory, whereas the Quick Ratio may be unsatisfactory.
Window-Dressing
Some companies in order to cover up their bad financial position resort to window dressing, i.e., showing a better position than the one which really exists.
Lack of Proper Standards
Circumstances differ from firm to firm hence no standard ratio can be fixed for all the firms.
For example if a firm has such type of relations with its bankers that it can get necessary credit in case of need, the ideal current ratio for the firm would be less than generally accepted current ideal ratio of 2:1.
Ration alone are not adequate for proper conclusions
They merely indicate the probability of favorable or unfavorable position. The analyst has to use other tools and techniques to further carry out the investigation and to arrive at a correct diagnosis.
Effect of personal ability and bias of the Analyst
Different person draw different meaning of the different terms.
For example one analyst may calculate ration on the basis of profit after interest and tax while another may consider profits before interest and Tax.
Classification of Ratios
Ratios may be classified in a number of ways to suit any particular purpose. Different kinds of ratios are selected for different types of situation.
Classification of ratios are based on:
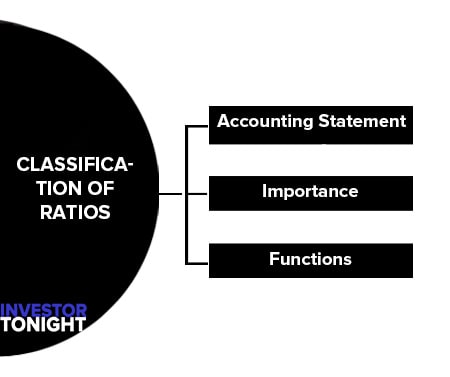
Classification According to Accounting Statement
This classification is based on the nature of accounting statement such as Balance sheet ratios. Profit and loss Account Ratios, combined ratios etc.
Classification According to Importance
It’s like primary ratios and secondary ratios. Some of the ratios are termed as primary and others are termed as subsidiary or supporting ratios.
Classification According to Functions
ratios are grouped as liquidity, Activity, Profitability, long term solvency and Market analysis ratios.
Approaches for Interpretation Ratios
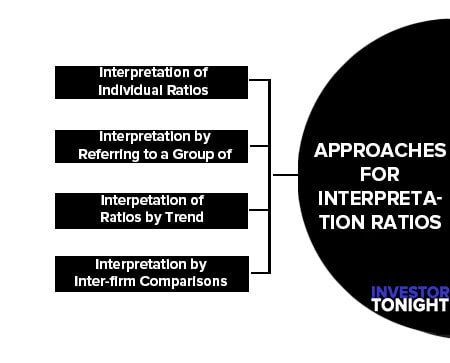
Generally, there are four different approaches for interpreting ratios:
- Interpretation of Individual Ratios
- Interpretation by Referring to a Group of Ratios
- Interpretation of Ratios by Trend
- Interpretation by Inter-firm Comparisons
Interpretation of Individual Ratios
A single ratio fails to reveal the true position. If it relates to preceeding years or compared with same type of other business or studied with reference to some standards, may be useful. Hence this approach is to be combined with others.
Interpretation by Referring to a Group of Ratios
The analysis could be made more meaningful by computing some of the additional related ratios. A Change in one ratio may have significance only when viewed in relation to other ratios.
Interpetation of Ratios by Trend
It involves a comparison of ratios of a firm overtime. The trend ratios indicate the directon of change over the years.
Interpretation by Inter-firm Comparisons
It involves comparison of the ratios of a firm with those of others in the same line of business or for the industry as a whole reflects its performance in relation to its competitors.
Classification of Ratio Analysis
Classification of ratio analysis are:
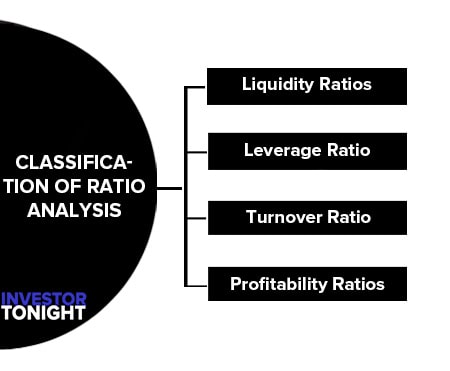
Liquidity Ratios
Liquidity or short-term solvency means ability of the business to pay its short-term liabilities. Inability to pay-off short-term liabilities affects its credibility as well as its credit rating. Continuous default on the part of the business leads to commercial bankruptcy.
Short-term lenders and creditors of a business are very much interested to know its state of liquidity because of their financial stake. Both lack of sufficient liquidity and excess liquidity is bad for the organization
Leverage Ratio
The leverage ratios may be defined as those financial ratios which measure the long term stability and structure of the firm. These ratios indicate the mix of funds provided by owners and lenders and assure the lenders of the long term funds with regard to:
- Periodic payment of interest
- Repayment of principal amount
Turnover Ratio
Turnover ratios are employed to evaluate the efficiency with which the firm manages and utilizes its assets. These ratios usually indicate the frequency of sales with respect to its assets. These assets may be capital assets or working capital or average inventory.
Profitability Ratios
The profitability ratios measure the profitability or the operational efficiency of the firm. These ratios reflect the final results of business operations.
Management attempts to maximize these ratios to maximize firm value. The results of the firm can be evaluated in terms of its earnings with reference to a given level of assets or sales or owner’s interest etc.
Read More Articles
- What is Financial Management?
- What is Financial Statements?
- What is Financial Statement Analysis?
- What is Ratio Analysis?
- What is Funds Flow Statement?
- What is Cash Flow Statement?
- What is Working Capital?
- What is Cost of Capital?
- What is Capital Budgeting?
- What is Dividend Policy?
- What is Cash Management?
- What is Depository?
- What is Insurance?
- What is Financial System?
- International Financial Reporting Standards
- Stability of Dividends
- What is Factoring?
- Determinants of Working Capital
- Public Finance
- Public Expenditure
- What is Public Debt?
- Classification of Public Debt
- Federal Finance
- Effect of Public Debt
- Expenditure Cycle