What is Financial Statement Analysis?
Financial Statement Analysis process of critical evaluation of the financial information contained in the financial statements in order to understand and make decisions regarding the operations of the firm.
It is basically a study of relationship among various financial facts and figures as given in a set of financial statements, and the interpretation thereof to gain an insight into the profitability and operational efficiency of the firm to assess its financial health and future prospects.
The term ‘financial analysis’ includes both ‘analysis and interpretation’. The term analysis means simplification of financial data by methodical classification given in the financial statements. Interpretation means explaining the meaning and significance of the data. These two are complimentary to each other.
Analysis is useless without interpretation, and interpretation without analysis is difficult or even impossible
Table of Contents
- 1 What is Financial Statement Analysis?
- 2 Financial Statement Analysis Definition
- 3 Users of Financial Statement Analysis
- 4 Objective of Financial Statement Analysis
- 5 Types of Financial Statement Analysis
- 6 Procedure of Financial Statement Analysis
- 7 Importance of Financial Statement Analysis
- 8 Tools of Financial Statement Analysis
Financial Statement Analysis Definition
According to Metcalf and Titard “The analysis of financial statements as a process of evaluating the relationship between component parts of financial statements to obtain a better understanding of the firm’s position and performance.”
According to Spicer and pegelar “Interpretation of accounts may be defined as the art and science of translating the figures in such a way as to reveal the financial strength and weakness of a business and the causeswhich have contributed therein.“
Users of Financial Statement Analysis
There are a number of users of financial statement analysis. They are:
- Creditors
- Investors
- Management
- Regulatory authorities
- Others Users
- Bankers and financial institutions
- Employees
- Government
- Trade associations
- Economists and researchers
- Taxation authorities
- Creditors: Anyone who has lent funds to a company is interested in its ability to pay back the debt, and so will focus on various cash flow measures.
- Investors: Both current and prospective investors examine financial statements to learn about a company’s ability to continue issuing dividends, or to generate cash flow, or to continue growing at its historical rate.
- Management: The company controller prepares an ongoing analysis of the company’s financial results, particularly in relation to a number of operational metrics that are not seen by outside entities (such as the cost per delivery, cost per distribution channel, profit by product, and so forth).
- Regulatory authorities: If a company is publicly held, its financial statements are examined by the Securities and Exchange board to see if its statements conform to the various accounting standards.
- Others:
- Bankers and financial institutions
- Employees
- Government
- Trade associations
- Economists and researchers
- Taxation authorities
Objective of Financial Statement Analysis
The main objectives of financial statements are being explained below:
- To measure profitability and to find out responsible factors in case of declining and improving profitability ratios.
- To measure financial soundness with the help of various ratios for corrective actions in case of adverse position.
- To measure operating efficiency through comparison of current year’s production, sales, expenses with last year’s figures of these items.
- To assessshortterm as well as long term solvency for creditors, debenture holders etc.
- To show trend of various items of financial statements e.g. sales, purchases, profits, expenses and to make strategies for future. This information will also help in budgeting and planning.
- To conduct inter-firm and intra-firm comparison for self evaluation and for operating efficiency to take corrective actions.
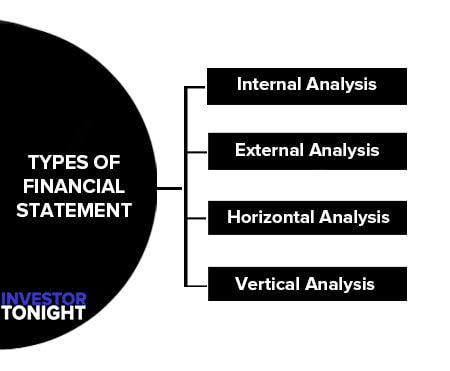
Types of Financial Statement Analysis
4 types of financial statement analysis are:
Financial statement analysis can be undertaken in different ways. The purpose of which the financial statement analysis to be undertaken and the person doing financial statement analysis are two main deciding factors of types of financial statement analysis.
Financial statement analysis may be categorised on the two main basis which are being presented here:
According to Material Used
Financial analysis according to this type can be of two type:
Internal Analysis
Executives and employees of the enterprise conduct internal analysis because they have access to the books of accounts and all other information related to business. Therefore, such analysis becomes more reliable and useful to management.
External Analysis
An external analysis is done by those who are outsiders for the business and do not have access to the detailed records of the company. Shareholders, prospective investors, creditors, bankers, governmental agencies, researchers are outsiders who conduct such analysis on the basis of published financial statements.
Increased governmental control over companies and governmental regulations have directed companies to disclose more detailed information’s in order to improve analysis.
According to Modus Operandi
This type of analysis can be classified in two categories
Horizontal Analysis
When financial statements for a number of years are reviewed and analyzed, it is termed as ‘Horizontal Analysis’. Under this method, figures of two or more years regarding each items are shown with changes from the base year.
Generally, the first year is assumed as base or standard year. Increase or decrease in each item as compared to base year is shown in percentage form.
For example, creditors shown in the balance sheet have increased or decreased as compared to the year 2011, and 2012. Horizontal analysis is used in comparative balance sheet and profit and loss account and in trend analysis.
Area of strength and weakness from considerable insight are given to the management by this analysis. It is also known as ‘Dynamic Analysis.
Vertical Analysis
It is a study of quantitative relationship of the various items in the financial statements on a particular date. It is related to one date or one accounting period.
Therefore, it is termed as ‘Static Analysis’. Common size balance sheet and profit and loss account are examples of vertical analysis. Totals of financial statements of a particular accounting period are taken as 100 and then all items related to that statement are converted into percentage.
For example, each item of Balance sheet is stated as a percentage of the total of the Balance sheet.
Procedure of Financial Statement Analysis
The analysis process of financial statements involves the compilation and study of financial and operating data. Analytical representation and promptness are attributes of ideal financial analysis.
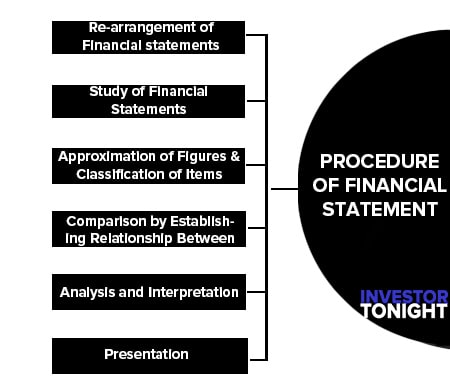
The following are the procedure of financial statement analysis:
- Re-arrangement of Financial statements
- Study of Financial Statements
- Approximation of Figures And Classification of Items
- Comparison by Establishing Relationship Between Items
- Analysis and Interpretation
- Presentation
Re-arrangement of Financial statements
First of all a financial statement analyst must know the object of financial statements analysis. Profit and loss account reveals trend of progress and Balance sheet depicts financial position. Director’s report and chairman speech are useful to know future plans. Financial data should be presented in a condensed form according to the object.
Study of Financial Statements
Detailed study of Balance sheet and Profit and loss account of current year and past years should be made to create a comprehensive vision and to guess about future.
Approximation of Figures And Classification of Items
The figures should be approximated to the nearest thousand or lakh of rupees to remove complexity of process. The items related to particular heading should be put at one place. Such classification of items will help in analysis.
Comparison by Establishing Relationship Between Items
Absolute figure is useless until it is compared with another figure. Various items are taken and a relationship with other item is established according to the object. An item of current year may be compared with its past year figures or may be compared with an other item.
For example sales of current year may be compared with last year’s sales or may be compared with gross profit, net profit or with different assets. Figures of a particular company may be compared with the figures of other company. All these depend on the object of analysis.
Analysis and Interpretation
On the basis of a comparative study, the analyst puts trend and changes. It presents important facts to take corrective action and to help in decision making according to object.
Presentation
After analysis and interpretation financial analysis draws inferences. These inferences may be presented either through report or diagrams.
Importance of Financial Statement Analysis
Financial statement analysis is useful for stakeholders because it helps in decision making form their point of view.
The importance of financial statement analysis may be understood from the points given below:
- Disclosure of Facts
- Comparative Study of Efficiency
- Help in Planning and Decision Making
- Effective Control
- Importance to various Stakeholders

Disclosure of Facts
Financial statements presents only figure of related various items. They do not provide information regarding solvency, requirement of working capital, liquidity position, debtor’s collection policy etc. Analysis of financial statements helps to answer of such questions and provides explanation about all required informations.
Comparative Study of Efficiency
various items are compared with past data of the firm and also with other firms engaged in the same business. It measures efficiency of business itself and in comparison to others.
Help in Planning and Decision Making
After analysis of financial statements, a firm may know increasing or decreasing trend of various items. It will provide a base for future planning and remedial measures can be planned for solution of future problems.There is no room for personal biasness in decision making because data are scientifically analysed.
Effective Control
Control can be exercised effectively in case of variations. Analysis of financial statement provides information regarding day to day activity of business. If there is any negative sign, corrective actions may be taken.
Importance to various Stakeholders
Investor, debenture holders, employees, management, government and researchers are various stakeholders who want to know different information’s related to them. Analysis of financial statement provides information’s to various stakeholders.
Tools of Financial Statement Analysis
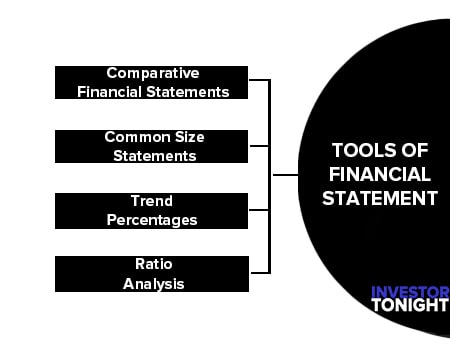
Comparative Financial Statements
When financial statements figures for two or more years are placed side-by-side to facilitate comparison, these are called ‘Comparative Financial Statements.’
Such statements not only show the absolute figures of various years but also provide for columns to indicate the increase or decrease in these figures from one year to another.
Common Size Statements
Common size statement that gives only the vertical percentages or ratios for financing data without giving rupee value are known as common size statements. A comparison of two years figures of a concern is easily made under the companies Act.
Companies must show in their profit and loss account and balance sheet the corresponding figures for the previous year. Sometimes however the figures do not signify anything as the head of items are regrouped and are incomparable. For a valid comparison, the previous heads should be strictly compared.
Trend Percentages
Trend percentages analysis moves in one direction-either upward or downward progression or regression. This method involves the calculation of percentages relationship that each statement bears to the same item in the base year. The base year may be any one of the periods involved in the analysis but the earliest period is mostly taken as the base year.
Ratio Analysis
Absolute figures expressed in monetary terms in financial statements by themselves are meaningless. These figures often do-not convey much meaning unless expressed in relation to other figures. The relationship between two figures, expressed in arithmetical term is called a ‘ratio’.
In the words of R. N. Anthony “A Ratio is simply one number expressed in terms of-another. It is found by dividing one number in to other.”
Ratio can be expressed in the following three ways:
- Pure Ratio or Simple Ratio
- Rate’ or ‘So Many Times
- Percentage
Read More Articles
- What is Financial Management?
- What is Financial Statements?
- What is Financial Statement Analysis?
- What is Ratio Analysis?
- What is Funds Flow Statement?
- What is Cash Flow Statement?
- What is Working Capital?
- What is Cost of Capital?
- What is Capital Budgeting?
- What is Dividend Policy?
- What is Cash Management?
- What is Depository?
- What is Insurance?
- What is Financial System?
- International Financial Reporting Standards
- Stability of Dividends
- What is Factoring?
- Determinants of Working Capital
- Public Finance
- Public Expenditure
- What is Public Debt?
- Classification of Public Debt
- Federal Finance
- Effect of Public Debt
- Expenditure Cycle