What is Company Analysis?
In the company analysis the investment analyst collect all the information related to the company and evaluates the present and future value of the stock. In this analysis, all the factors affecting the earnings of a particular company are considered. The risk and return associated with the purchase of a stock is analyzed to make a better investment decision.
The valuation process depends upon the investor ability to elicit information from the relationship and inter-relationship among the company related variables. Up-to-date information is required on the status and trends in the economy, particular industries and firms.
In the previous articles we have discussed about Economic Analysis and Industry Analysis and now in this lesson light is thrown on company analysis.
Table of Contents
Success in investing will be largely dependent on:
- Discovering new and credible information rapidly and in more details then others do. This depends upon the analyst ability to develop a system that couples original thoughts and unique ways of forming expectations about the prospects for individual company. For this purpose various public and private sources of information are analyzed.
- Applying superior judgement so as to ascertain the relevance of information to the decision at hand. Judgement depends upon one’s knowledge and experiences. By applying various tools of analysis to the data, the investor formulates expectations and judgement about the alternatives available to him.
For company analysis, the internal and external information need to be studied. Internal information consists of data and events made public by firms concerning their operations. The principle information sources generated internally by a firm are its financial statements.
External sources of information are those generated independently outside the company. They provide supplement to internal sources. A good analyst must train himself to understand the kind of flexibility permitted in accounting and the effect of this flexibility on his interpretation of what he sees.
For company analysis, the factors that need to be considered and the methods of analyzing a financial statement of the company are highlighted in the following lines.
Company Analysis
Fundamental analysis is the method of analyzing companies based on factors that affect their intrinsic value. There are two sides to this method: the quantitative and the qualitative. The quantitative side involves looking at factors that can be measured numerically, such as the company’s assets, liabilities, cash flow, revenue and price-to-earnings ratio.
The limitation of quantitative analysis, however, is that it does not capture the company’s aspects or risks unmeasurable by a number – things like the value of an executive or the risks a company faces with legal issues. The analysis of these things is the other side of fundamental analysis: the qualitative side or non-number side. Although relatively more difficult to analyze, the qualitative factors are an important part of a company. Since they are not measured by a number, they more represent either negative or positive force affecting the company.
But some of these qualitative factors will have more of an effect, and determining the extent of these effects is what is so challenging. To start, identify a set of qualitative factors and then decide which of these factors add value to the company, and which of these factors decrease value. Then determine their relative importance. The qualities one analyzes can be categorized as having a positive effect, negative effect or minimal effect.
The best way to incorporate qualitative analysis into evaluation of a company is to do it once you have done the quantitative analysis. The conclusion come to on the qualitative side can put quantitative analysis into better perspective. If when looking at the company numbers one saw good reason to buy/invest in the company, but then found many negative qualities, he may want to think twice about buying/investing. Negative qualities might include potential litigations, poor R and D prospects or a board full of insiders.
The conclusions of qualitative analysis either reconfirm or raise questions about the conclusions of quantitative analysis. Fundamental analysis is not as simple as looking at numbers and computing ratios; it is also important to look at influences and qualities that do not have a number value.
The present and future values are affected by the following factors (Figure 1):
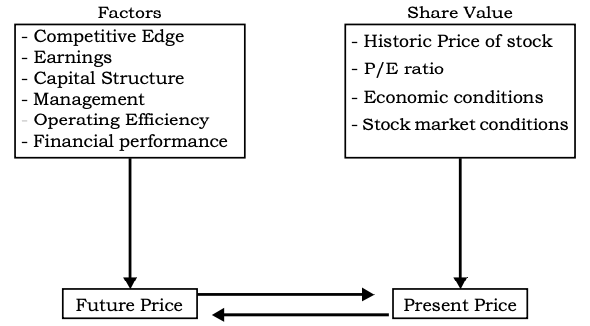
Competitive Edge
Many industries in India are composed of hundreds of individuals companies. The large companies are successful in meeting the competition and some companies rise to the position of eminence and dominance.
The companies who have obtain the leadership position; have proven his ability to withstand competition and to have a sizable share in the market. The competitiveness of the company can be studied with the help of:
The market share of the company helps to determine a company’s relative position with in the industry. If the market share is high, the company would be able to meet the competition successfully. The size of the company should also be considered while analyzing the market share, because the smaller companies may find it difficult to survive in the future.
Growth of Annual Sales
The investor generally prefers to study the growth in sales because the larger size companies may be able to withstand the business cycle rather than the company of smaller size. The rapid growth keeps the investor in better position as growth in sales is followed by growth in profit. The growth in sales of the company is analyzed both in rupee terms and in physical terms.
Stability of Annual Sales
If a firm has stable sales revenue, other things being remaining constant, will have more stable earnings. Wide variation in sales leads to variation in capacity utilization, financial planning and dividends. This affects the company’s position and investor’s decision to invest.
Earnings
The earning of the company should also be analyzed along with the sales level. The income of the company is generated through the operating (in a service industry like banks- interest on loans and investment) and non-operating income (ant company, rentals from lease, dividends from securities). The investor should analyze the sources of income properly.
The investor should be well aware with the fact that the earnings of the company may vary due to the following reasons:
- Change in sales
- Change in costs
- Depreciation method adopted
- Inventory accounting method
- Wages, salaries and fringe benefits
- Income tax and other taxes
Capital Structure
Capital structure is combination of owned capital and debt capital which enables to maximize the value of the firm. Under this, we determine the proportion in which the capital should be raised from the different securities. The capital structure decisions are related with the mutual proportion of the long term sources of capital. The owned capital includes share capital.
Preference shares are those shares which have preferential rights regarding the payment of dividend and repayment of capital over the equity shareholders. At present many companies resort to preference shares. The preference shares induct some degree of leverage in finance.
The leverage effect of the preference shares is comparatively lesser than that the debt because the preference shares dividend are not tax deductible. If the portion of preference share in the capital is large, it tends to create instability in the earnings of equity shares when the earnings of the company fluctuate.
Debt
It is an important source of finance as it has the specific benefit of low cost of capital because interest is tax-deductible. The leverage effect of debt is highly advantageous to the equity shareholders. The limits of debt depend upon the firm’s earning capacity and its fixed assets.
Management
The basic objective of the company is to attain the stated objectives of the company for the good of the equity holders, the public and employees. If the objectives of the company are achieved, investor will have a profit. Good management results in high profit to investors.
Management is responsible for planning, organizing, actuating and controlling the activities of the company. The good management depends upon the qualities of the manager.
Operating Efficiency
The operating efficiency of the company directly affects the earnings capacity of a company. An expanding company that maintains high operating efficiency with a low break even point earns more than the company with high break even point.
If a firm has stable operating ratio, the revenues also would be stable. Efficient use of fixed assets with raw materials, labour and management would lead to more income from sales. This leads to internal fund generation for the expansion of the firm.
Financial Performance
Balance Sheet
The level, trends, and stability of earnings are powerful forces in the determination of security prices. Balance sheet shows the assets, liabilities and owner’s equity in a company. It is the analyst’s primary source of information on the financial strength of a company.
Accounting principles dictate the basis for assigning values to assets. Liability values are set by contracts. When assets are reduced by liabilities, the book value of share holder’s equity can be ascertained. The book value differs from current value in the market place, since market value is dependent upon the earnings power of assets and not their cost of values in the accounts.
Profit and Loss account
It is also called an income statement. It expresses the results of financial operations during an accounting year i.e. with the help of this statement we can find out how much profit or loss has taken place from the operation of the business during a period of time. It also helps to ascertain how the changes in the owner’s interest in a given period have taken place due to business operations.
Last of all, for analyzing the financial position of any company following factors need to be considered for evaluating the present situation and prospects of a company. The questions that need to be answered for company analysis are:
- Availability and Cost of Inputs: Is the company well placed with respect to the availability of basic raw materials, power, fuel and other production inputs? What are the costs advantages/disadvantages of the company vis-à-vis its competitors?
- Order Position: What is the order position of the company? How many months or years of production does it represent? Is the order position improving or deteriorating?
- Regulatory Framework: What is the licensing policy applicable to the industry to which the firm belongs? Are there any price and/or distribution controls applicable to the company? If so, what are their implications for profitability?
- Technological and Production Capabilities: What is the technological competence of the firm? What is the state of its plant and machinery? Does the company have unutilized capacity to exploit favourable market developments?
- Marketing and Distribution: What is the image of the company in the marketplace? How strong is the loyalty of its customers/clients? What is the reach of the distribution network?
- Finance and Accounting: What are the internal accruals? How much access the companies have to external financing? What are the products in the portfolio of the company? How competitive is the position of the company in these products?
- Human Resourceand Personnel: Howcompetentandskilled is the workplace of the company? Is the company over-staffed or under-staffed? What is the extent of employee turnover and absenteeism? What is the level of employee motivation and morale?
All information relating to these factors may be available from the annual reports and from the published sources also. The first hand information is also available from the official sources of the company.
Company Analysis: Study of Financials Statements
Financial statement means a statement or document which explains necessary financial information. Financial statements express the financial position of a business at the end of accounting period (Balance Sheet) and result of its operations performed during the year (Profit and Loss Account).
In order to determine whether the financial or operational performance of company is satisfactory or not, the financial data are analyzed. Different methods are used for this purpose. The main techniques of financial analysis are:
- Comparative Financial Statements
- Trend Analysis
- Common Size Statement
- Fund Flow Statement
- Cash Flow Statement
- Ratio Analysis
Comparative Financial Statements
In comparative financial statement, the financial statements of two periods are kept by side so that they can be compared. By preparing comparative statement the nature and quantum of change in different items can be calculated and it also helps in future estimates.
By comparing with the data of the previous years it can be ascertained what type of changes in the different items of current year have taken place and future trends of business can be estimated.
Trend Analysis
In order to compare the financial statements of various years trend percentages are significant. Trend analysis helps in future forecast of various items on the basis of the data of previous years. Under this method one year is taken as base year and on its basis the ratios in percentage for other years are calculated. From the study of these ratios the changes in that item are examined and trend is estimated.
Sometimes sales may be increasing continuously and the inventories may also be rising. This would indicate the loss of market share of a particular company’s product. Likewise sales may have an increasing trend but profit may remain the same. Here the investor has to look into the cost and management efficiency of the company.
Common Size Statement
Common size financial statements are such statements in which items of the financial statements are converted in percentage on the basis of common base. In common size Income Statement, net sales may be considered as 100 percent. Other items are converted as its proportion.
Similarly, for the Balance sheet items total assets or total liabilities may be taken as 100 percent and the proportion of other items to this total can be calculated in percentage.
Fund Flow Statement
Income Statement or Profit or Loss Account helps in the ascertainment of profit or loss for a fixed period. Balance Sheet shows the financial position of business on a particular date at the close of year. Income statement does not fully explain funds from operations of business because various non-fund items are shown in Profit or Loss Account.
Balance Sheet shows only static financial position of business and financial changes occurred during a year can’t be known from the financial statement of a particular date. Thus, Fund Flow Statement is prepared to find out financial changes between two dates. It is a technique of analyzing financial statements.
With the help of this statement, the amount of change in the funds of a business between two dates and reasons thereof can be ascertained. The investor could see clearly the amount of funds generated or lost in operations. These reveal the real picture of the financial position of the company.
Cash Flow Statement
The investor is interested in knowing the cash inflow and outflow of the enterprise. The cash flow statement expresses the reasons of change in cash balances of company between two dates. It provides a summary of stocks of cash and uses of cash in the organization. It shows the cash inflows and outflows. Inflows (sources) of cash result from cash profit earned by the organization, issue of shares and debentures for cash, borrowings, sale of assets or investments, etc.
The outflows (uses) of cash results from purchase of assets, investment redemption of debentures or preferences shares, repayment of loans, payment of tax, dividend, interest etc. With the help of cash flow statement the investor can review the cash movement over an operating cycle. The factors responsible for the reduction of cash balances in spite of increase in profits or vice versa can be found out.
Ratio Analysis
Ratio is a relationship between two figures expressed mathematically. It is a quantitative relationship between two items for the purpose of comparison. Ratio analysis is a technique of analyzing financial statements. It helps in estimating financial soundness or weakness.
Ratios present the relationships between items presented in profit and loss account and balance sheet. It summaries the data for easy understanding, comparison and interpretation. The ratios are divided in the following group:
Liquidity Ratios
Liquidity rations means ability of the company to pay the short term debts in time. These ratios are calculated to analyze the short-term financial position and short term financial solvency of firm. Commercial banks and short term creditors are interested in such analysis. These ratios are:
- Current Ratio = Current Assets / Current Liabilities
- Acid Test Ratio = (Current assets – Inventories) / Current Liabilities
Turnover Ratios
These ratios show how well the assets are used and the extent of excess inventory. The different type of turnover ratios are as follows:
- Inventory turnover ratio = Net Sales / Inventory
- Receivables turnover ratio = Net Sales / Receivables
- Fixed assets turnover ratio = Net Sales / Fixed Assets
- Total assets turnover ratio = Net Sales / Total Assets
Profit Margin Ratios
Earning of more and more profit with the optimum use of available resources of business is called profitability. The investor is very particular in knowing net profit to sales, net profit to total assets and net profit to equity. The profitability ratio measures the overall efficiency and control of firm.
Net Profit Margin = Profit after Tax / Sales
Forecasting Earnings
There is strong evidence that earnings have a direct and powerful effect upon dividends and share prices. So the importance of forecasting earnings can not be overstated. These ratios are generally known as ‘Return on Investment Ratios’.
These ratio help in evaluating whether the business is earning an adequate return on the capital invested or not. With the help of the following ratios the performance of the business can be measured. The earning forecasting ratios are:
- Return on Total Assets
- Return on Equity
- Earnings and Role of Financing
- Valuation Ratios: Earnings and Dividend Level
Return on Total Assets
Changes in reported earnings can result from changes in methods of accounting, changes in the operations of the business and/or in financing of business, that is, changes in productivity or resource base. This ratio represents the overall efficiency of capital invested in business.
This ratio can also be called as gross capital employed ratio. The total assets here are a combination of fixed assets and current assets. The Return on Total Assets is calculated as follows:
Return on Assets = Net Income (EBIT) / Total Assets
In general, the greater the return on assets, the higher the market value of the firm, other things being equal. Return on assets is the product of the turnover of assets and the margin of profits:
Return on Assets = (Sales / Assets) * (Earnings before interest and Tax / Sales)
Return on Equity
This ratio is calculated to evaluate the profitability of the business from the point of view of ordinary shareholders.
Return on Equity = Net Profit / Net Worth
Or
Return on Equity = Equity Earnings / Equity
Or
ROE = [(Profit after tax / Sales) / Net Profit Margin] * [(Sales / Assets) / Assets Turnover] * [(Assets / Equity) / Leverage]
Earnings and Role of Financing
Borrowing of money at a fixed cost and the use of these funds to earn return on assets is known as employing leverage. If one can earn more on borrowed money than you have to pay for it, the leverage is to firm’s advantage.
However, leverage should be used within reasonable limits because excessive use of debt relative to equity increases borrowing costs and also the cost of equity funds. The volatility of share holders returns increases with the expansion of the degree of financial leverage. The greater volatility of earnings owing to increased leverage can, at certain levels of debt financing, cause the market to pay less per rupee of earnings.
Further with the use of more debts it may become progressively difficult to maintain (or improve) the rate of return on assets. One of the best ways of measuring the proportions of debt and equity financing is:
- Debt to asset ratio = Total Debt / Total Assets
- Debt to equity ratio = Total Debt / Net Worth
- Long term debt to equity = Long Term Debt / Net Worth
Valuation Ratios: Earnings and Dividend Level
- Book value per share
- Earnings per share (EPS)
- Dividend per Share (DPS)
- Dividend Payout Ratio (D/P ratio)
- Dividend and Earnings Yield
This ratio indicates the share of equity shareholders after the company has paid all its liabilities, creditors, debenture holder and preference shareholders. It is calculated as follows:
Book value per share = (Paid up Equity share capital + Reserves & Surplus) / Total number of equity shares outstanding
This ratio measures the earnings per share available to ordinary shareholders. Equity shareholders have the right to all profits left after payment of taxes and preference dividend. This ratio is calculated by dividing the profits available for equity shareholders by the number of equity shares issued.
EPS = Equity Earnings or EAT / Number of equity shares outstanding
This ratio is quite significant. EPS affects the market value of shares. It is an indicator of the dividend paying capacity of the firm. By comparing the EPS with other firms, management can know whether ordinary share capital is being utilized effectively or not.
All the profits after tax and preference dividend available for equity shareholders are not distributed among them as dividend. Rather, a part of it is related in
business. The balance of profits is distributed among equity shareholders. To calculate dividend per share, the profits distributed as dividend among equity shareholders is divided by a number of equity shares.
DPS = Profits distributed to Equity shareholders / Number of Equity shares
Dividend Payout Ratio (D/P ratio)
This ratio establishes the relationship between the earnings available for ordinary shareholders and the dividend paid to them. In other words, it explains what percentage of profit after tax and preference dividend has been paid to equity shareholders as dividend. It can be calculated as under:
D/P ratio = Equity Dividends / Equity Earnings
Dividend and Earnings Yield
These ratios are used to evaluate the profitability from the stand point of ordinary shareholders. Earning per share (EPS) and Dividend per Share (DPS) are calculated on the basis of book value of shre but yield is always calculated on the basis of market value of shares. This ratio is called as Earnings Price ratio.
Dividend Yield = Dividend per share / Market value per share
Earnings Yield = Earnings per share / Market value per share
P/E ratio = Market Price of the share / EPS
Practical Example
Competitive Benchmarking Reports RocSearch Competitive Benchmarking Report provides information that enables a company to analyze and compare its financial performance, business segments, geographical presence, products and services and business strategies vis-à-vis its competitors.
- GOLD Analysis: The Gold Profiles provide very comprehensive information about the company. These reports include price history and charting, an extended business summary, the five- year financial history and information on management, insiders and institutions.
The Gold Profiles also successfully outline the strategic position of the company within the market and provide detailed information on the functioning of the company under various constraints. - Silver Analysis: The Silver Profiles are a scaled down version of the Gold Profiles that provide detailed information about the company. These include information on performance of the company, its strategy, joint ventures, key executives, new products, M&A etc.
Timely, precise and up-to-date information presented in these reports allows decision makers to make successful strategic decisions. - Porter Analysis In the globalised market scenario, companies need to understand and challenge the competitive markets they operate in. RocSearch analysts use Porter’s Five Forces Framework developed by marketing guru Michael Porter to analyze various industries and enable companies to identify and develop appropriate strategies.
- PEST Analysis: PEST refers to all Political, Economic, Social and Technological factors affecting any industry. RocSearch’s acclaimed team of industry analysts religiously follow industry trends and monitor any changes that occur in the business scenario.
All reported information including insider titbits is examined and analysed to produce an original document that effectively mirrors the external business environment. - SWOT Analysis: Our industry analysts put into perspective all political, economic, social and technological factors affecting any industry to identify the emerging opportunities for any company operating in that industry.
Strengths and weaknesses of the company are analyzed to establish whether it can take advantage of the emergent opportunities. Various threats that can hamper its progress are also examined and listed. The findings can be used to take advantage of opportunities and to make contingency plans for threats.
Read More Articles